Overview
This project explores a Kaggle dataset of 3,500 ecommerce transactions. I followed a standard EDA workflow — loading and cleaning the data, then exploring sales and profit trends across categories, products, regions, and time periods. The data is clean but synthetic: all profit values are positive and margins cluster around 17%, suggesting it was generated rather than collected from real sales.
Data & Preparation
The dataset contains 3,500 rows across 7 columns, loaded from a CSV and parsed with Pandas:
# Load and inspect data
df = pd.read_csv("data.csv")
df.info()
df.describe()

RangeIndex: 3500 entries, 0 to 3499
Data columns (total 7 columns):
 #   Column        Non-Null Count  Dtype
---  ------        --------------  -----
 0   Order Date    3500 non-null   datetime64[ns]
 1   Product Name  3500 non-null   object
 2   Category      3500 non-null   object
 3   Region        3500 non-null   object
 4   Quantity      3500 non-null   int64
 5   Sales         3500 non-null   int64
 6   Profit        3500 non-null   float64
dtypes: datetime64[ns](1), float64(1), int64(2), object(3)
memory usage: 191.5+ KB
Exploratory Analysis
A look at overall sales and profit performance across categories and products.
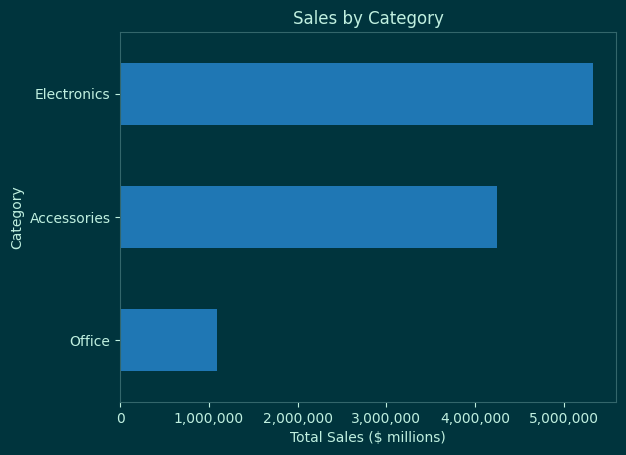
Sales by Category
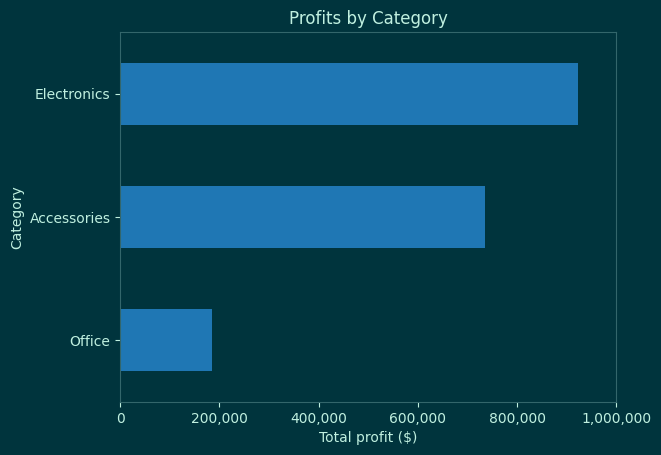
Profits by Category
Key Findings
Deeper dive into top performers and trends across the dataset.
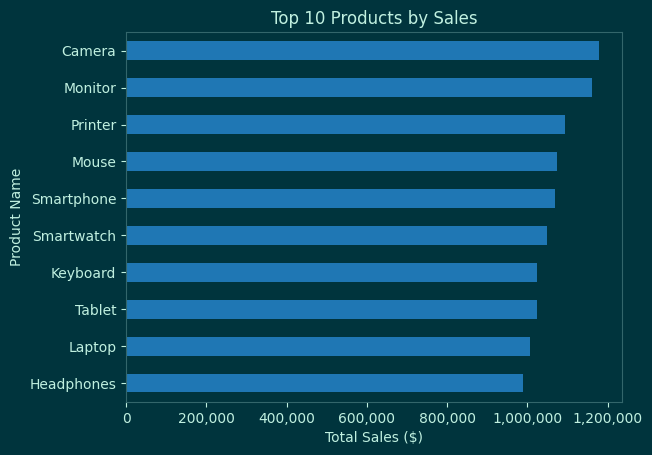
Top 10 Products by Sales
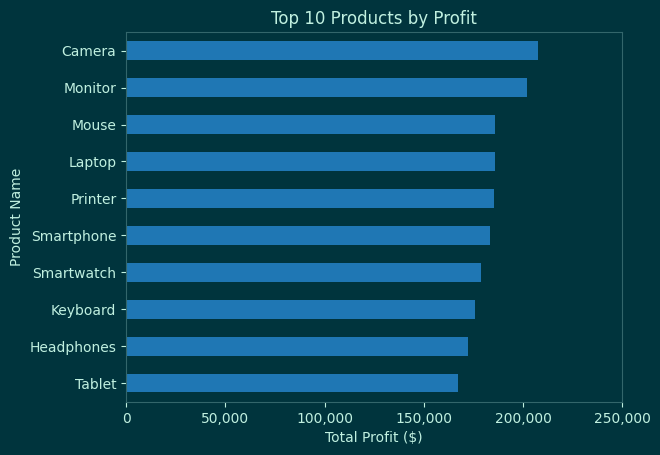
Top 10 Products by Profit
Top 10 products by margin:
Product Name  Category
Camera        Electronics    0.178177
Laptop        Electronics    0.177311
Headphones    Accessories    0.174675
Smartwatch    Electronics    0.173527
Mouse         Accessories    0.173300
Monitor       Accessories    0.173281
Printer       Office         0.172839
Keyboard      Accessories    0.172123
Smartphone    Electronics    0.171899
Tablet        Electronics    0.169807
Name: Margin, dtype: float64
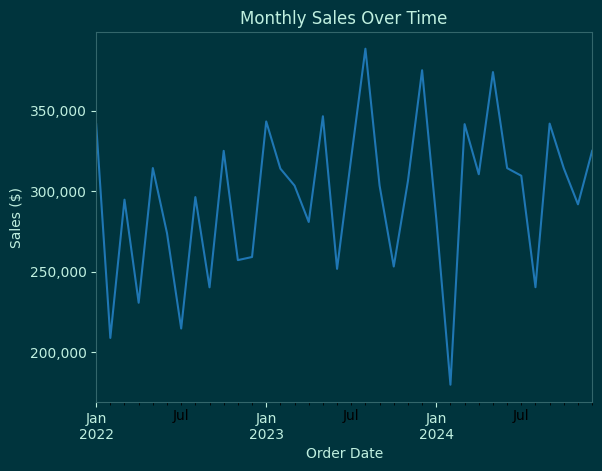
Monthly Sales Over Time
Conclusion
- Electronics leads in both sales and profit across all categories.
- December is the strongest month for profit.
- February is the weakest month for profit.
- Products have margins around 17% — data is most likely fake (from Kaggle datasets).
Recommendations
- Increase marketing focus on Electronics
- Offer incentives during February (promotions, discounts)
- Investigate the uniform product margins further
This analysis was based on an example dataset from Kaggle — very clean data. The superficial nature of the product margins would suggest this data was not taken from any real sales data, but it demonstrates my ability to gather and present insights.