Overview
Analysis of the Consumer Financial Protection Bureau (CFPB) consumer complaints dataset, examining complaint volumes by product, company response patterns, issue categories, and resolution trends over time.
Data & Preparation
This dataset was downloaded from Kaggle. You can find it here.
The Kaggle dataset contained both a .CSV and .sqlite download, with a table called "Consumer_complaints" containing 18 columns and 555,957 total rows.
This project aims to demonstrate the use of SQL queries for data exploration. I used the following methods:
- Aggregation and conditional aggregation
- Subqueries
- Grouping
- Ordering
- Limiting
Exploratory Analysis
Complaints by product and monthly volume over five years
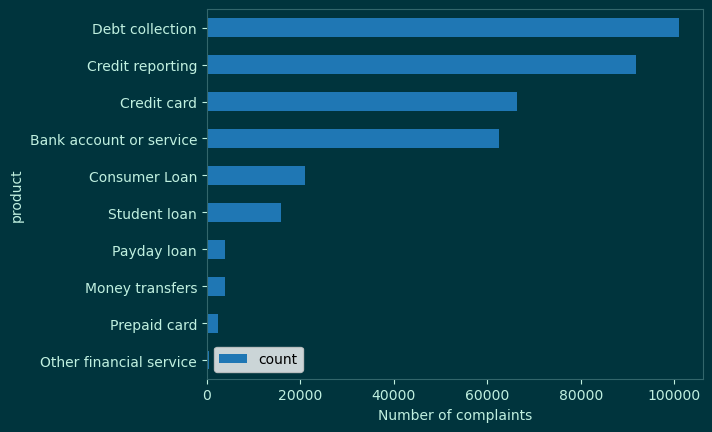
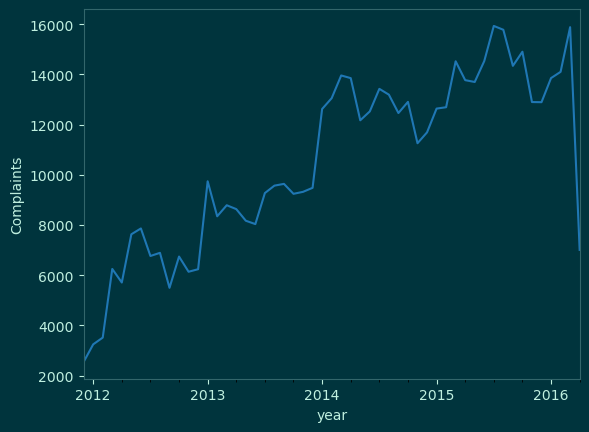
Complaint volume between late 2011 and early 2016 saw a massive increase in monthly complaints. The sharp drop at the end of the timeline is likely due to data collection delays rather than an actual decline. Debt collection and credit reporting complaints make up the bulk of the volume, which makes sense given the nature of these products.
Complaints by Product
Monthly Complaints Volume
Company response rates and dispute rates by submission channel
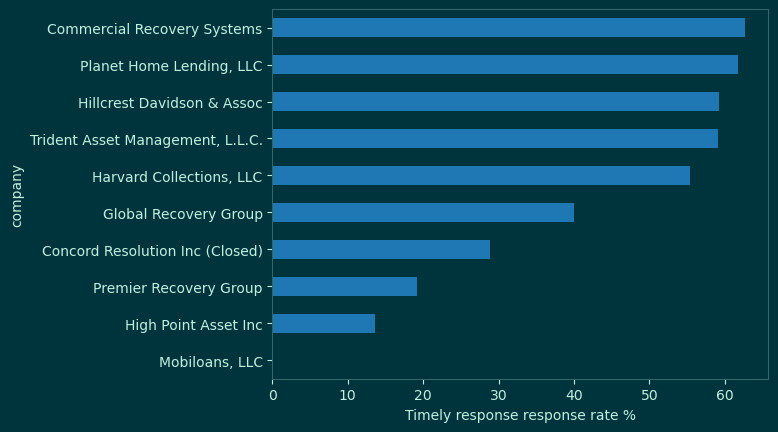
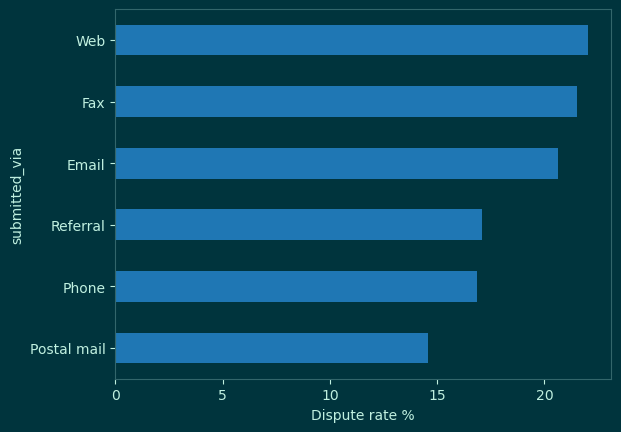
Companies handling over 1,000 complaints had timely response rates above 90%. To see more variation, I filtered for companies with more than 100 complaints — their response rates are shown in the chart on the left. The chart on the right shows dispute rate by submission channel. Web has the highest dispute rate at 22%, closely followed by Fax at 21.5% and Email at 20.6%. One possible explanation is that consumers who take the time to file via web or fax tend to be more engaged and more likely to follow up.
Company Response Rate
Dispute Rate by Submission Channel
Interactive complaint map
This is a map of the US highlighting states by number of complaints raised. California had by far the most complaints, followed by Texas, Florida, and New York. Hover over each state for a precise count.Complaints by State (Interactive)
Key Findings
- Monthly complaint volume grew steadily from 2011 to 2016, with debt collection and credit reporting accounting for the majority of complaints — consistent with the high-volume nature of these consumer finance products.
- Companies handling over 1,000 complaints maintained timely response rates above 90%, while smaller companies showed significantly more variance, suggesting less standardised complaint handling processes/capabilities
- Dispute rates vary considerably by submission channel: Web (22.0%), Fax (21.5%), and Email (20.6%) are the highest, while traditional channels like Phone (16.8%) and Postal mail (14.6%) see fewer disputes per complaint.
Conclusion
This project explores a large consumer complaints dataset using SQL to uncover patterns in complaint volume, company responsiveness, and dispute outcomes. The analysis highlights that company size correlates with response consistency, and that digital submission channels tend to lead to higher dispute rates. Further work could explore per-capita complaint rates by state, seasonal trends in complaint volume, or the relationship between company response time and dispute likelihood.
To see This blogpost on my thoughts building this project, click here